Running a WooCommerce store without proper financial reporting is like driving blindfolded. You may see revenue increasing, but without knowing your costs, margins, and profit, you can’t make smart business decisions. That’s where the ProfitBlue WooCommerce plugin comes in.
ProfitBlue is a financial reporting plugin designed to give store owners real-time visibility into revenue, costs, and profits. In this step-by-step tutorial, you’ll learn how to set it up, configure your data, and use its dashboards to analyze your business.
What ProfitBlue Does for WooCommerce
At its core, ProfitBlue tracks your store’s profit and loss (P&L) in real time. Instead of juggling spreadsheets or waiting for your accountant, you can see:
- Total revenue (sales, shipping, and fees)
- Cost of Goods Sold (COGS)
- Variable costs (ads, payment fees, packaging, etc.)
- Fixed costs (rent, software, IT, salaries)
- Net profit or loss after all expenses
By bringing all this data together, the plugin helps you understand exactly how much money your store is keeping — not just how much it’s making.
Step 1: Explore the Profit & Loss Report
The first thing you’ll see in ProfitBlue is the P&L report. This table is the heart of your financial analysis, showing:
- Revenue – Pulled directly from WooCommerce orders, including product sales, shipping, and extra fees.
- COGS (Cost of Goods Sold) – Enter the purchase price of your products to calculate true margins.
- Variable Costs – Expenses that scale with sales, such as payment processing, shipping, handling, and ads.
- Fixed Costs – Monthly recurring expenses like rent, IT, or licenses.
- EBT (Earnings Before Tax) – Profit after costs but before tax.
- Net Profit or Loss – The final number that shows your store’s true financial performance.
This overview gives you instant clarity on whether your store is growing profitably.
Step 2: Configure Data Settings
To get accurate reports, you’ll need to enter some key financial data. ProfitBlue makes this easy through its Data Settings.
- Custom Costs & Income – Add fixed costs (rent, salaries, licenses) or extra income (supplier bonuses). You can apply them monthly or spread them across the year.
- Variable Costs – Add expenses like packaging, payment fees, or advertising. You can set them as percentages of revenue or fixed amounts per order.
- COGS (Cost of Goods Sold) – Assign the purchase price to each product. You can do this manually for individual products or bulk-import via Excel.
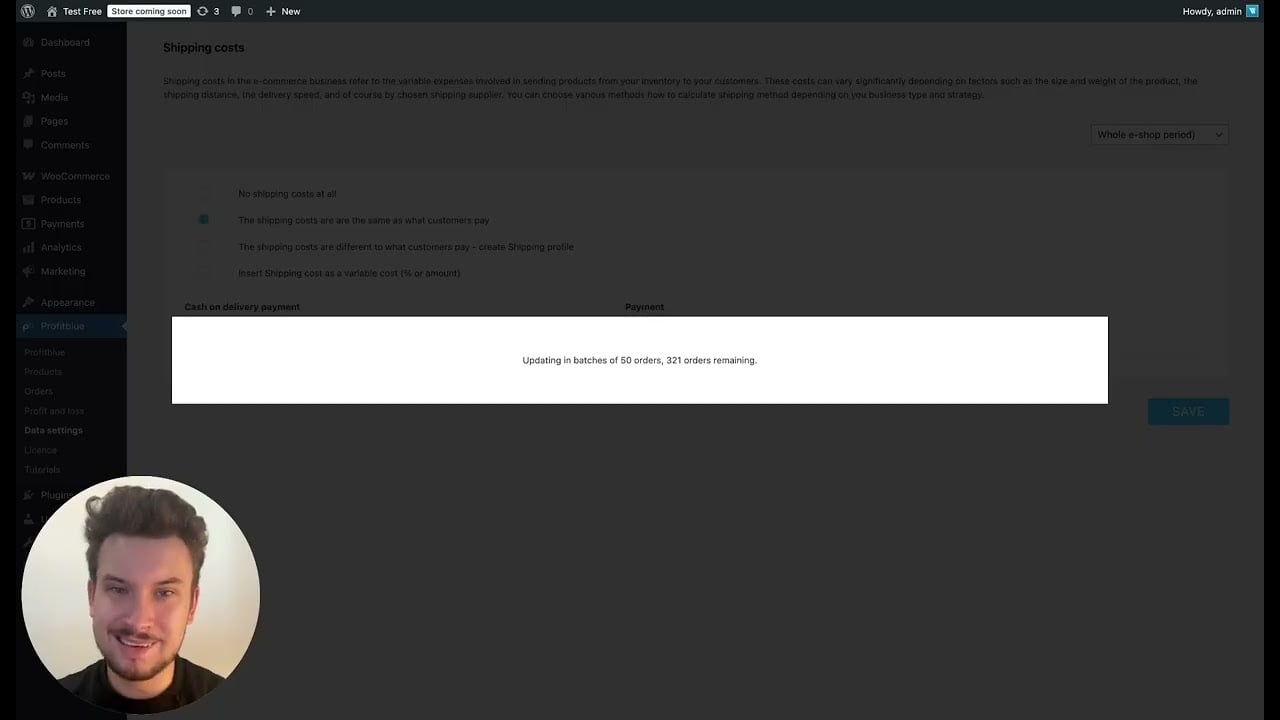
- Shipping Costs – Choose whether to set them to zero, match customer shipping fees, or define your own formulas.
- Payment Fees – Enter the fees charged by gateways like Stripe, PayPal, or bank transfers.
- Tax on Income – Set your country’s corporate income tax rate for accurate net profit calculations.
Once entered, ProfitBlue automatically applies these values across your reports in real time.
Step 3: Analyze the Overview Dashboard
The Overview page is where ProfitBlue really shines. Here you can:
- Track revenue, orders, gross profit, and net profit over any time range.
- Compare performance month-to-date, year-to-date, or against last year.
- Monitor average order value, gross margin percentage, and other key ratios.
- Visualize trends with graphs that show revenue vs. profit over time.
- Identify which costs are eating into your margins with a detailed cost analysis split between fixed and variable costs.
This dashboard helps you spot problems early, like rising ad spend or shrinking margins, so you can act before cash flow becomes an issue.
Step 4: Dive Into Product and Order Analysis
Beyond overall profit, ProfitBlue also shows profitability at the product and order level.
- Product Analysis – See revenue, COGS, gross profit, and margin for every product in your store. Identify your best sellers, most profitable items, and least profitable products.
- Order Analysis – Review individual orders with breakdowns of revenue, costs, and profit margins. This helps you understand the impact of shipping, fees, or discounts on profitability.
With this detail, you can adjust pricing, stop promoting loss-making products, and double down on your most profitable items.
Step 5: Make Data-Driven Decisions
ProfitBlue isn’t just about numbers — it’s about turning insights into actions. For example:
- If ad costs are too high, you’ll see it instantly and adjust budgets.
- If a product has low or negative margins, you can reprice or discontinue it.
- If fixed costs take too much of your revenue, you know it’s time to increase sales volume or renegotiate expenses.
Because the plugin updates in real time, you don’t need to wait months to catch problems. You can make changes daily, ensuring your WooCommerce store stays profitable.
Final Thoughts
The ProfitBlue WooCommerce plugin transforms financial reporting from a guessing game into a clear, real-time process. By setting up your COGS, variable costs, and fixed costs, you gain instant insight into your profit and loss.
Instead of focusing only on sales numbers, you’ll know your actual profitability — and have the data you need to grow sustainably.
If you’re serious about running a profitable WooCommerce store, ProfitBlue is one of the smartest tools you can add to your stack.