The Overview tab in the ProfitBlue WooCommerce plugin turns raw store data into a clear financial dashboard. Instead of digging through tables, you get a visual snapshot of revenue, costs, margins, and profit so you can make decisions fast. If the P&L tab is your ledger, the Overview is your cockpit.
What the Overview Tab Shows
The top cards summarize your current period at a glance:
- Revenue – Total sales including product sales, shipping, and fee revenue pulled from WooCommerce orders.
- Number of Orders – Volume context for your revenue.
- COGS (Cost of Goods Sold) – What you paid suppliers for the items sold.
- Gross Profit – Revenue minus COGS.
- Net Profit – What you actually keep after COGS, variable costs, and fixed costs.
Secondary metrics help you understand efficiency:
- Average Order Value (AOV)
- Average Items per Order
- Average Amount per Item
- Gross Margin %
- Shipping & Fees (revenue components and their impact)
How to Read the Main Graph
Toggle between Revenue, COGS, Gross Profit, Gross Margin %, Orders, Net Profit. Blue bars/line represent the current period; red represents the previous year for quick trend comparison. Use it to:
- Spot seasonality and campaign lift
- Validate that profit trends follow (not lag far behind) revenue trends
- Catch margin compression early (rising revenue with flat/declining gross or net profit)
Pro tip: If revenue grows faster than gross profit, review COGS and discounting. If gross profit grows but net profit doesn’t, investigate variable and fixed costs.
Orders Snapshot
Jump into recent orders to see order-level margin. This is where hidden leaks show up:
- High shipping or payment fees on specific orders
- Discount-heavy orders eroding margins
- Bundles with mis-set COGS
Use filters (date ranges, statuses) to isolate problematic batches (e.g., a campaign period).
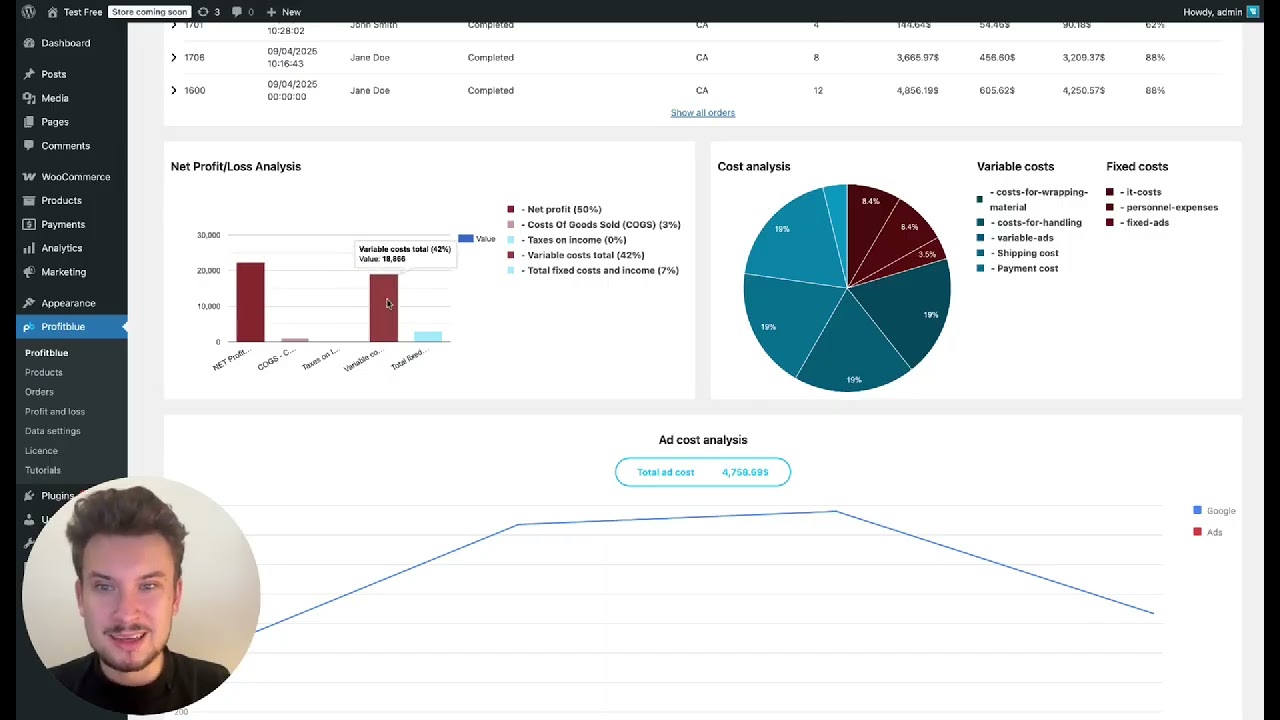
Net Profit / Loss Analysis
This breakdown shows how each cost bucket contributes to the final result. Typical buckets:
- COGS
- Variable Costs (payment fees, packaging/handling, shipping cost, ad spend)
- Fixed Costs (rent, software, salaries/licenses)
- Income Adjustments (supplier bonuses, rebates)
Questions to ask:
- Are variable costs creeping above target (e.g., >12–18% for many stores)?
- Are fixed costs too heavy for current volume?
- Did COGS increase (supplier price hikes, currency, freight)?
Cost Analysis: Fixed vs. Variable
A side-by-side view separates fixed and variable costs so you can act precisely:
- If variable costs are high: optimize ads, payment fees, shipping contracts, packaging.
- If fixed costs are high: grow volume to dilute them, or renegotiate/eliminate line items.
Ad Cost Analysis
When you log ad spend in Data Settings, the Overview displays it against outcomes. Use it to:
- Ensure paid media scales profitably (watch net profit alongside spend)
- Compare channels (Meta vs. Google) by period
- Decide whether to cap, pause, or double down
Rule of thumb: rising spend must raise gross profit at least proportionally; if not, revisit targeting and creative.
Product & Category Insights
Cards and tables highlight:
- Best Sellers (by revenue)
- Most Profitable (by gross profit)
- Least Profitable (potential phase-out or reprice)
- Category Analysis (revenue, COGS, margin, margin %)
Actions:
- Promote high-margin winners (features, ads, bundles)
- Fix or retire low-margin SKUs (renegotiate COGS, raise price, reduce costs)
- Build bundles to lift AOV where margins allow
Time Range Controls & Comparisons
Switch between day, week, month, quarter, year, or custom ranges. Compare to last year to assess growth quality. Two essential views:
- Month-to-Date (MTD) for live steering of budgets and promos
- Year-to-Date (YTD) cumulative performance to keep big-picture goals on track
Daily Workflow With the Overview Tab
- Scan top cards (Revenue, Orders, Gross, Net) for anomalies.
- Check the main graph for trend breaks vs. last year.
- Open Net Profit/Loss Analysis to see which cost bucket changed.
- Review Orders Snapshot if margins dipped yesterday/today.
- Glance at Ad Cost Analysis and pause underperforming campaigns.
- Check Product/Category tables to reallocate promotion to high-margin winners.
Total time: ~5 minutes. Decisions: immediate.
Setup Checklist to Keep Data Accurate
- Enter COGS per product (or bulk import) so gross profit is correct.
- Add variable costs (percent of revenue or amount per order) for payment, shipping, packaging.
- Enter fixed costs (monthly rent, software, salaries/licenses).
- Log ad costs by channel for clean attribution.
- Set Income Tax % in Shop Settings if you want post-tax net profit.
Common Pitfalls (and How to Avoid Them)
- No COGS → inflated profit. Bulk import COGS as a first step.
- Understated shipping/payment costs → margin looks better than reality. Add actual rates.
- Ad spend not logged → net profit overreported. Add Meta/Google monthly.
- Mixed periods → misleading comparisons. Align date range before judging performance.
Quick Wins for WooCommerce Profit Tracking
- Raise prices on SKUs with proven high conversion and low return rate.
- Create high-margin bundles to lift AOV without discounting.
- Negotiate carrier rates and payment gateway tiers as volume grows.
- Trim promos that boost revenue but hurt net profit.